What California and Kansas Can Teach Us about the Laffer Curve and Tax Theory

Since the economic collapse that began in 2008, politicians and lawmakers all across the United States have been on the move to enact policy that will stimulate the economy and bring back jobs. Tax policy has inevitably become part of this national discussion. The Laffer Curve, an economics theory that posits that cutting taxes is beneficial for economic stimulation, has been put to the test in two real life scenarios that have played out in Kansas and California. The results provide significant evidence that calls into question the well-worn principle that a higher minimum wage decreases overall employment and income.
Arthur Laffer’s Theory
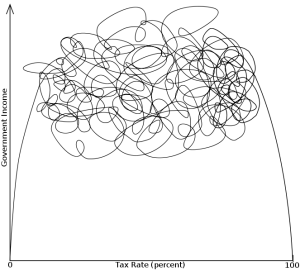
The Laffer Curve, one of the fundamental tenets of supply-side economics, was popularized by the economist Arthur Laffer in the late 1970s. As a curve, it merely demonstrates the relationship between tax rates and total tax revenues collected by the government. According to this construct, the effect of a lower tax rate is an increase in work, output, and employment whereas a high tax rate penalizes these activities. The curve is often used to explain and justify the pro-growth worldview of supply-side economics. It should be noted, however, the Laffer Curve does not say definitively that a tax cut will raise or lower revenues. For example, a tax rate of 100% wouldn’t collect more money than a rate of 25%, as no one would be willing to work for an after-tax income of $0. The value of the Laffer Curve is its ability to predict economical behavior based on simple arithmetic truths.
Kansas Tax Cuts & California Tax Hikes
In the case of Kansas, after the election of Sen. Sam Brownback as governor in 2010, the state rolled out a new tax policy, a virtual low-tax paradise that was eventually meant to eliminate the state income tax. Brownback’s administration consulted Laffer on tax cuts and enacted these measures in the hopes that, according to the Laffer Curve, they would help to fuel the stagnant economy. The measures, called “the largest tax cut ever” at the time, were enacted in 2012. It quickly became clear that Kansas’ economy was not following the upward trajectory the Laffer Curve predicted it should. As a result, the state’s credit rating was lowered, first by Moody’s Investors Service and later by Standard & Poor’s, who cited “a structurally unbalanced budget.”
Meanwhile in California, tax rates were rising as much as 30 percent, raising the sales tax to the highest in the nation at 7.5 percent. The Laffer Curve indicates that California’s job growth should have slowed to a crawl and brought the state’s economy to a grinding halt. This October Governor Jerry Brown was happy to announce that the measures had quite the opposite effect, stating “California is back.”
Contradictory to what proponents of the Laffer theory may have predicted, it was California that came out the winner. Jobs in the state grew at a rate 3.4 times greater than in Kansas, and non-farm payroll jobs increased 7.2 percent in California compared to just 2.1 percent in Kansas. California’s credit rating also improved, unlike Kansas’, which means that the state can borrow money at much lower rates than Kansas can. So what happened? Do these real-life contradictions mean that the Laffer Curve doesn’t work?
What Real Life Contradictions Mean
No economic model is perfect. If anything, what these real world contradictions tell economists is that their models need more refinement, but it sends a message to politicians as well. The real world will always trump theory, and changes in policy would be better based on actual data about the number of jobs and what they pay rather than projections, ideology and theory.
It could be that raising the minimum wage will, in the fullness of time, lead to different results. California’s economy could still collapse, and Kansas could see the job growth its experts hoped for originally. Kansas may fall behind yet further with their frozen minimum wage. For now, it would be wise of policymakers to look at the results and take note. No theory, however compelling, should be more persuasive than real-life results.


